using ATR to restrict market purchases
After re-checking the simulations I’d done recently, I realised I had the wrong broker fee marked in, which meant that even though the simulation said I was making a 1% return every day, I was actually losing money in reality.
The script was originally making LIMIT buys and sells, which my experience showed rarely caused a fee, so I’d marked that as a 0.1% fee in the simulation vs the normal 0.3% that a MARKET trade has. But the simulation didn’t take into account that LIMIT trades sometimes don’t get filled. The market might be at 147, for example, so you try to sell your 4 Litecoin (eg) for 147, but by the time you get the order uploaded, the market might have shifted down. Now you’re stuck with an unfulfilled order.
To solve this, I changed the script to only use MARKET trades, which are guaranteed to sell/buy, but also are guaranteed to incur a fee of 0.3%.
When I plugged 0.3% into my simulation, I was suddenly not making any money at all. Instead, I was losing money. In fact, the simulation showed I was losing money so badly that if I started with €1,000,000 46 days ago, I would be down to €14 today. That’s bad.
Looking at a 6hr chart of the Litecoin market, we can see where the money vanished.

On the 6hr chart, the highlighted area looks very flat, like nothing is happening there. So you would not expect any trade to happen. But if you zoom into the area, you can see that trades are still happening, even though they value isn’t changed very much in absolute terms.
Let’s zoom in even further, to the area that’s highlighted:
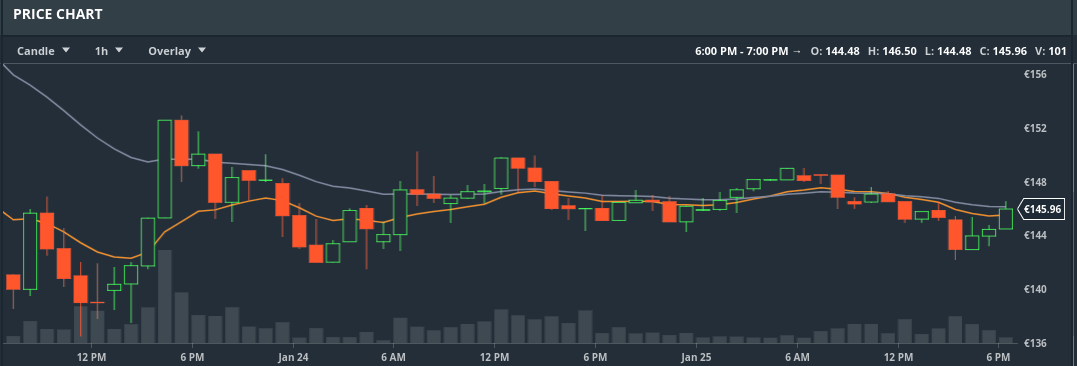
You can see that the value is rising and falling vigorously, but this is an illusion. If you look at the figures on the right, you see that the LTC is oscillating between about €142 per coin to €150 per coin. That’s about a 5% range. Remember that the fee we’re trying to avoid is 0.3%, so this /might/ be okay to trade with.
But the script trades minute by minute, not hour by hour. So let’s look at what the market does in that range by zooming in even further:

That’s one hour of data. In the preceding image, the above image is what’s contained in the single bar all the way on the right. In it, the price of Litecoin rises steadily from €144 to €146.
Worth buying?
144 to 146 is less than 1.4% of a rise. If you buy €100 worth of LTC at the beginning of this rise, and sell it at the end, it will cost you €0.30 to buy (so you’ll actually spend €100.30), the value will increase from €100 to €101.39, and then when you sell, there will be a fee of €0.31.
So even though the price went up, from €100 to €101.39, you will only have made €0.78.
This is still a profit, but if the rise was less, it might have been a loss.
Example, let’s say it was 200 to 201
You invest €100 and pay your €0.30 fee. The value increases to €100.50. You then cash out. Now you’ve just lost money, because the fees add up to €0.61, but the price increase was only €0.50.
Buying when the increase is so small can be dangerous, because if the increase isn’t enough, then you will lose money.
So how to solve this?
The problem has to do with the volatility of the market. For the last few days in Litecoin land, there pretty-much hasn’t been any!
After realising the above, I made a small adjustment to my script so that it refused to allow any trades at all if the volatility was too small. I did this by measuring the ATR (average true range), and if it was below a certain range (1.5 or so), then even if the script signalled a buy or sell, it was stopped in its tracks.
This had an immediate and amazing effect on the returns.
Beforehand, with a 0.1% fee, I was getting a 1.25% return daily in my simulations, but now I’m getting a 2.8% return daily on a 0.3% fee. That’s HUGE! In money terms, if I invested €20 46 days ago on the 9th of December (chosen by finding the oldest data point which had a value higher than the most recent data point), then that €20 would now mbe worth €73.80.
You can check these figures for yourself.
Here’s the list of buys and sells that it came up with for that time. Compare that with the GDAX charts to see where it was making its decisions:
| Date | Total Holdings | Euro | Litecoin | Decision |
| 2017-12-09 06:16:00 | 20 | 20 | 0 | sell (EMA) |
| 2017-12-09 18:19:00 | 19.94063602112 | 0.15264306112 | 0.1467952 | buy (SMA) |
| 2017-12-12 03:31:00 | 29.367424251546 | 29.068528237546 | 0.0014974 | sell (EMA) |
| 2017-12-12 03:48:00 | 29.304203063656 | 0.221864459656 | 0.1352604 | buy (EMA) |
| 2017-12-12 15:14:00 | 38.521751703256 | 38.129916903256 | 0.0013797 | sell (EMA) |
| 2017-12-12 15:31:00 | 38.458243719256 | 0.291011719256 | 0.1192726 | buy (EMA) |
| 2017-12-12 16:15:00 | 35.489678406936 | 35.129576972936 | 0.0012166 | sell (EMA) |
| 2017-12-13 19:09:00 | 35.340416940661 | 0.268105949661 | 0.1354091 | buy (SMA) |
| 2017-12-19 21:14:00 | 39.434991448454 | 39.034291516454 | 0.0013812 | sell (Chandelier exit) |
| 2017-12-20 07:04:00 | 39.299779309244 | 0.297920919244 | 0.1412599 | buy (SMA) |
| 2017-12-20 13:56:00 | 40.357168121734 | 39.947332934734 | 0.0014409 | sell (SMA) |
| 2017-12-22 04:12:00 | 40.175830888054 | 0.304884745054 | 0.1655289 | buy (SMA) |
| 2017-12-22 05:22:00 | 38.593556557054 | 38.201847757054 | 0.0016884 | sell (EMA) |
| 2017-12-22 07:54:00 | 38.430341158372 | 0.291552148372 | 0.188349 | buy (SMA) |
| 2017-12-22 08:14:00 | 35.965964610874 | 35.600994246874 | 0.0019212 | sell (EMA) |
| 2017-12-22 08:37:00 | 35.881484581174 | 0.271701481174 | 0.1771631 | buy (EMA) |
| 2017-12-22 11:24:00 | 39.402103180134 | 39.001776317134 | 0.0018071 | sell (EMA) |
| 2017-12-22 15:15:00 | 39.223938974334 | 0.297663674334 | 0.2081619 | buy (SMA) |
| 2017-12-22 23:36:00 | 49.655726432778 | 49.150763226778 | 0.0021233 | sell (EMA) |
| 2017-12-24 03:46:00 | 49.523277677268 | 0.375125812268 | 0.2013031 | buy (SMA) |
| 2017-12-24 03:53:00 | 48.586558079894 | 48.093334886894 | 0.0020533 | sell (EMA) |
| 2017-12-24 12:22:00 | 48.422843305894 | 0.367057305894 | 0.2089382 | buy (SMA) |
| 2017-12-25 02:34:00 | 51.421578583214 | 50.899264087214 | 0.0021312 | sell (Chandelier exit) |
| 2017-12-28 19:25:00 | 51.208545412331 | 0.388455939331 | 0.2352673 | buy (SMA) |
| 2018-01-06 05:27:00 | 53.762217368481 | 53.216166876481 | 0.0023998 | sell (SMA) |
| 2018-01-16 22:55:00 | 53.395286595271 | 0.406147617271 | 0.3772543 | buy (SMA) |
| 2018-01-17 01:04:00 | 58.597851304252 | 58.002527224252 | 0.003848 | sell (EMA) |
| 2018-01-17 16:11:00 | 58.311595018118 | 0.442668760118 | 0.4627293 | buy (SMA) |
| 2018-01-17 22:56:00 | 73.798156976318 | 73.047692876318 | 0.0047199 | sell (EMA) |
Notice that the script has not made any decisions in the last few days (today’s the 25th). That’s because the last few days, there’s been nothing interesting happening in the market so it’s holding on to what it has.
Here’s a pretty picture showing the above in line format
